Unofficial blog for XLRI – PGCBM 14 Batch

Colloborate… Conquer…

Corporate Finance – Time Value of Money

Posted by shyamrajagopalan on July 22, 2008

Subject :- Corporate Finance

Date : 12-Jul-2008

Time Value of Money

Key Principle :- The valuation of money depends on time. A rupee today is worth more than a rupee tomorrow or years to come, the simple reason being the rupee (in hand today) could be used to earn interest if invested today (also factors like Inflation comes to play).

The concept of value of money deals with the elementary concepts covered in Mathematics (8th, 9th Std), of Interest (Simple and Compound). In a real life scenario, simple interest is not used much, as the returns on Simple interest are fractional compared to Compound Interest for a specific period of time.

Hence two key things to consider are 1. Compounded Rate 2. Discounted Rate

Present Value of Money is the Discounted Vaue of Future Value

Future Value of Money is Compounded Value (As the rate is compounded) of the Present Value

Image Source – Courtesy :- Investopedia.com

Instead of doing complex calculations around 1+i to the power n, we can arrive at the compounded interest factor for FV (FVIF), and the discounted interest factor for PV(PVIF), using the tables.

The valuation of money is key to making decisions around investments and project, which will derive future value. Of course these needs to be seen in conjunction with the Opportunity costs.

PVIF, and FVIF are used when we receive a fixed cash flow in the future. However in case of Annuity, the fixed payments paid over a period of time has to be considered and factored as well.

Annuity refers to a fixed payment paid which will terminate after a specific period of time.  It differs from Perpetuity in that the period is Infinite.

Annuity is of 2 types

Ordinary Annuity – Paid at the end of each period/term (Interest on Deposits etc)

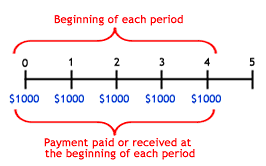
Annuity Due – Paid at the begining of each period/term (Fees, Rent etc)


Why these two are seen differently is because of the payout involved during a different time scale, which in turn affects the calculation of the value.

Future Value of Annuity Due = Future Value of Ordinary Annuity * (1+i)

Money Doubler Formulae:

As discussed in class, if we quickly have to figure out in what period of time, our money will double given an interest rate, we should use the rule of 72.

Years = 72/Rate of Interest

A more precise formula would be Years = 0.35 + 69/Interest Rate

In all the formulae above, the frequency of compounding was considered to be a year. It can be half-yearly, quarterly etc, and the calculations will change based on the compounding frequency.

A depiction of the cashflow using a time line is a good way to approach the problems involving Time Value of Money. Also the cash flows can sometimes be inflows or outflows, and constant or variables.

More on Risk/Returns & CAPM to follow in the next recap….

Posted in Corporate Finance, Time Value of Money | Leave a Comment »

Corporate Finance – Quiz on Aug 2nd

Posted by shyamrajagopalan on July 17, 2008

*** Announcement ****

A 20 Mark quiz on Corporate finance has been scheduled for the 2nd of August! Topics include the sections covered so far. More details refer your emails

Njoy!

Posted in Announcement, Corporate Finance | 5 Comments »

Updates from Rohit – 07-Jul-2009

Posted by shyamrajagopalan on July 8, 2008

  1. Pls upload your photographs in AIS, to facilitate the admit card for exams. This is of high priority
  2. Exam Details – Schedule, Do’s and Don’ts
  3. Feedback for the courses – POM, MANAC1 and MANAC2. Feedback submission is a must to see the marks for the various courses (uploaded to AIS)

More details, from the horse’s mouth in your respective email boxes.

Posted in Official Communication, Rohit | 1 Comment »

Top 10 Ways to Disrupt a Class!!!

Posted by shyamrajagopalan on July 7, 2008

  • Greet Everyone (Harmless)
  • Ask where someone is working on Public Chat (Harmless)
  • Network using Public Chat (Exchange Mobile Numbers) (Harmless)
  • Shout Echo….(Harmless)
  • Congratulate fellow participants (Harmless)
  • Ask the prof. to refresh the slide (Harmless)
  • Raise your hand and not ask a question, but say what you have understood, err… Summarize (Harmful)
  • Hijack the class with your thought process (Harmful)
  • Getting Stuck / do not move and don’t let others move on (likes of Mr.Nagarkar) (Harmful)
  • Be a real pain!!!! (likes of Mr.Guleria)  – All of the above (beats every item on the list) – (Harmful)

No offense meant, but sometimes it is really killing the flow of a class. If you really want to have a blast, then should pro’ly look for a different place, for the class is no place to look for vibrancy. Or least use private chat (to vent out whatever). Have kripa on fellow students folks!!! Aren’t we getting overboard with this?

Posted in Piece of my mind | 4 Comments »

Corporate Finance (Financial Management) – 07-Jul-2008

Posted by shyamrajagopalan on July 7, 2008

Prof: – Prantik Ray

Attendees :- 189

Financial Mgmt. by definition is defined as Acquisition, Financing and Management of Assets to realize the short term/long terms goals of the firm.

Most folks started getting “”googlied” by this parlance and started to draw comparisons with Financial Accounting. Financial Accounting solely deals with reporting historical financial information. Financial Mgmt is purely a Managerial function tied with the future direction of the firm and hence has loads of decision making.

Financial Mgmt. has assumed significance because of Market Evolution, and hence more roles have been added to the umbrella Mgmt discipline, to include Risk Mgmt, Treasure Mgmt, Dividend Decisions and Mergers/Acquisitions.

So what are the decisions a Finance Manager make?

To summarize that, any firm needs sources of funds to utilize them towards the goals of the company. Hence a Finance Manager decides on how to source the funds, how to best utilize them for maximizing returns/ or whatever is in the best interests of the firm/shareholders. The decision making is aligned with the direction of the firm.

Decisions are

1. Investment Decisions (Project Valuation (Purely by discounted cash flow), Valuing Flexibility, Size of the firm, Assets Required, Assets to be avoided/eliminated). Capital Budgetting

2. Financing Decisions (How the Investment Decisions will be financed, best way of financing, dividend policies, how will the funds be acquired?). Capital Structure.

3. Net Working Capital Decisions
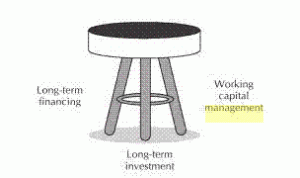
And lo…Here cometh our classic dividend discussions? Why and how should a company pay dividends? The dividend is calculated mainly on the basis of the company’s unappropriated profit and its business prospects for the coming year. If there are no major avenues to invest/park the profits, the management decides to return the exess to the investorts. In case of “Growth Stocks”, the company will retain the earnings internally to fund future growth. Hence it is purely company’s discretion to declare dividends, which again is a decision process keeping the long term interests in Mind. In India, a company has to pay taxes for dividends, while for the shareholders, the dividend income is tax-free.  The company again may pay dividends in cash or share buybacks. These are better left to be dealt under Corporate Actions. For now, we should be fine understanding this as is. KG – Savvy?

3. Asset Management Decisions (Once the asset is on the books, how are they managed. Management of Current Assets over Fixed Assets)

Why should the focus be on managing current assets over fixed assets? – Once the decisions are made with respect to the Fixed assets (Thanks Aloke), there is nothing much a FM (like our Finance Minister) can do barring managing depreciation decisions/Tax Planning. It is the current assets which can/have to be managed/decided for better working results.

Goals of a Firm

Maximization of Shareholder Wealth – Value creation occurs on share price maximization.

Takes into account current and future profits and EPS, the timing, duration, and risk of profits and EPS, dividend policy, all other relevant factors.

Hence the share price serves as a barometer for business performance (ideally speaking)

A few alternative goals could be

1. Profit Maximization : – Maximizing the firm’s profits after taxes. It may not be appropriate because it does not consider the riskiness of returns and it ignores the timing of returns. e.g.  If the firm operates in a perfectly competitive environment, the goal of profit maximization is not possible, while it is possible in a Monopoly. If the IT companies had Profit Maximization as the goal, it may  not be possible to sustain because of increased competition, US Recession etc, and have to re-align the goals. TCS for e.g. has volume business (emphasis on Sales), while Infosys has Margin business (Emphasis on Profit Margins) to an extent though the goals may be different in each cases.

2. Earnings Per Share Maximization : –

Disadvantages to this

1. Not Time Bound/Ignores Long term risks

2. EPS can be maximized by reducing or nullifying dividends (above equation)

That said, a company’s goal can be different/unique.

Real world examples (as constantly asked in the class)

Dow Chemical Company: “maximize long-term shareholder value”
ExxonMobil: “long-term, sustainable shareholder value” (Though there is a recent and an interesting twist in this goal. Read http://www.ethicalmarkets.com/?p=700)

MODERN CORPORATION
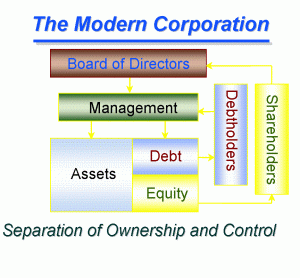
And voila… here comes the class stopper. The evergoing discussion on

1. Properietory : – A sole proprietor is not separate from the individual; what the business makes, so does the individual. Unlimited Liability. Single Taxation. Risks more. Issues in Transferring the Business.  example. Your neighbourhood Tea Shop, Idli shop

2. Partnership : – A partnership is a type of business entity in which partners (owners) share with each other the profits or losses of the business undertaking in which all have invested. Favourable Taxation. Agreement is Required.

  • Limited Liability Partnership : – A limited partnership is a form of partnership similar to a general partnership, except that in addition to one or more general partners (GPs), there are one or more limited partners (LPs).
  • Limited Liability Limited Partnership (LLLP):- Very Recent in the US.

Examples include most law firms and CA firms in India.

3. Corporation : –

  • Legal Entity to conduct business different from the “Owners”
  • Limited Liability : End with Ltd., Inc., Plc etc (Shareholders and Employers not liable for Debt obligations)
  • Unlimited Life : Going Concern Concept
  • Pay Corporate Tax/Double Taxation
  • Private Ltd and Public Ltd (By Type based on Public(equity) participation)
  • Profit and Not-for-Profit (Again Types)

Examples Include Public Ltd : – Infosys Technologies Limited, NTPC Ltd

Private Ltd : – Sita Travels Pvt Ltd, KPN Travels Pvt Ltd

4. Limited Liability Company

  • is a type of business ownership combining several features of corporation and partnership structures
  • is not a corporation or a partnership
  • owners are called members not partners or shareholders
  • Limited Liability
  • No Disclosure Required
  • Better Taxation
  • has issues to go public if decided later on

Examples :  Most Real Estate Companies in the US (e.g Century 21 Real Estate, Coldwell Banker Real Estate)

Most modern day businesses are corporations with a clear demarcation between Owners and the Management.

Agency Theory : Principals (Owners) and Agents (Managers). Principals provide Incentives to Agents to work on their behalf. (Economics Theory)

Corporate Governance : – System through which Corporations are managed/controlled.

Organization of Finance Management : – VP Finance or CFO heading a team of Treasury and

Control Functions.
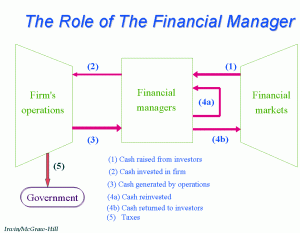
Markets can typically be

1. Equity or Debt and are contributed in turn by Savings from People, Companies and Government.

Posted in Corporate Finance, Finacial Management | 3 Comments »

Ratio Analysis – MAC – 29-June-2008

Posted by shyamrajagopalan on July 6, 2008

Ratio Analysis : – Ratio of selected values based on the company’s financial statement. There are many standard ratios used to evaluate the overall financial condition of a corporation or other organization.

Who Uses the Ratios : – Corporate Finance Managers, Current/Potential Shareholders, Creditors

Common Size Analysis – Ratio comparisons are done on Past performances, Competing Firms, Absolute Standards, Industry Trends, Budgets – Planning/Control

Profitability For shareholders, employees, creditors, investors, management.
Liquidity For shareholders, management, suppliers, creditor and competitors.
Efficiency For management, shareholders, creditors and competitors.
Gearing For shareholders, lenders, creditor and potential investors.
Investment For shareholders, potential investors, management.

Ideally companies should be Liquid and Profitable, and hence we pay more attention to the Liquidity Ratios and the Profitability Ratios.

Key Liquidity Ratios

    Current Assets
  Current Ratio = ————————
    Current Liabilities
      
 
    Quick Assets
  Quick Ratio = ———————-
    Current Liabilities
     
Quick Assets = Current Assets – Inventories

Quick Ratio is significant in Industries where Inventory is more or less the finished product. e.g. Pen Industry.

Case Study on HUL, MARICO and Doctors Soap, and discussion about Monopoly (Market)  and Monopsony(Creditors). HUL though having lesser ratio has higher Monopoly and Monopsony, indicating there are no benchmarks for these numbers and are dependent on the Industry/Competetive positions.

Long Term Solvency Ratios

    Total Liabilities
  Debt to Equity Ratio = ———————————-
    Total Stockholders’ Equity


    Long Term Liability
  LT Debt Equity Ratio = ——————————————————-
    Networth/ Total Stockholder’s Equity 

Times Interest Earned Ratio (TIE Ratio)

    PBIT (Before Interest and Tax)
  TIE ———————————-
    Interest Expense

TIE Ratio of > 1 is necessary to pay bare interest necessities

A ratio of > 10 is considered a very safe position.

Inventory Turnover Ratio : – A ratio showing how many times a company’s inventory is sold and replaced over a period.

    Cost Of Goods Sold
  Inventory Turnover Ratio —————————-
    Average Inventory

A low turnover rate may point to overstocking, obsolescence, or deficiencies in the product line or marketing effort. A high turnover rate may indicate inadequate inventory levels, which may lead to a loss in business.

Effeciency Ratios : – Inventory Collection Period, Average Collection Period, Average Payment period

Inventory Collection Period : – (Inventory * 365)/Cost of Goods Sold

Average Collection Period :-  (Acc. recievable * 365)/ Credit Sales (The collection period or average collection period must be compared to competitors to see whether the credit given, and customer risk, is in line with the industry. A high collection period shows a high cost in extending credit to customers). Lower ACP means more Monopoly.

Average Payment Period :- (Acc. Payable * 365) / Purchases. Lesser APP means lower Monopsony.

e.g. ICP = 70 Days, ACP = 85 Days, APP = 45 Days. Deduction Cycle = 155 days on which the company has to self finance for 110 days.

Profitability Analysis Ratios   
 
    PAT + Interest + Taxes
  Return on Assets (ROA) = ———————————-
    Average Total Assets
     
Average Total Assets = (Beginning Total Assets + Ending Total Assets) / 2
   
 
    PAT
  Return on Equity (ROE) = ————————
    Stockholders’ Equity


    PAT + Interest
  Return on Common Equity (ROCE) = ——————————————–
    Stockholders’ Equity


    Net Income
  Profit Margin = —————–
    Sales
     
     
    Net Income
  Earnings Per Share (EPS) = ———————————————
    Number of Common Shares Outstanding
   

Return on Equity (ROE)

    PAT                 Sales                          Total Assets
  Return on Equity (ROE) = ——–  *      ———————-  *     ————————
    Sales           Total Assets                      Networth
     

In essence ROE = Margin * Asset Turnover Ratio * Leverage

Things to remember about Asset Turnover Ratio

  • Companies with low profit margins tend to have high asset turnover, those with high profit margins have low asset turnover – it indicates pricing strategy.
  • This ratio is more useful for growth companies to check if in fact they are growing revenue in proportion to sales.

Market Ratios

    Market Price of Common Share            Mkt Cap
  PE Ratio = ————————————– =                  ———————–
    Earnings Per Share                              Profit After Tax
   
    Annual Dividends Per Common Share
  Dividend Yield = ————————————–
    Market Price Per Share
   

Posted in Financial Analysis, MAC, Management Accounting, Ratios | 2 Comments »

Will continue shortly!

Posted by shyamrajagopalan on July 1, 2008

Sorry for leaving the blog n the woods for quite sometime. In between switching jobs and the whole gamut of things that come along with that…. Will resume shortly. Lots to catch up, talk about, munch about…

Posted in Piece of my mind | Leave a Comment »

POM Updates 14/6

Posted by shyamrajagopalan on June 17, 2008

Date :- 14/June/2008

Attendees :- 191

Session 1: – Marketing Environment, Environmental Scanning, SWOT, Environmental Analysis,  Factors, Marketing Environment Hierarchy, PEST

Marketing Environment :- All the external factors to the decision maker (Marketer), that directly or indirectly affect the marketing of the product/brand/organization. Even company entities (like production etc) are considered to be external to the marketer.

There are three key perspectives on the marketing environment, namely the ‘macro-environment,’ the ‘micro-environment’ and the ‘internal environment’.

                                              Marketing Environment

Macro – Across Industy Segments. PEST Factors, Also incl. Natural Factors like Tsunami etc. Examples include Inflation, Income, Company Policies (Epilator – Phillips example) etc

Micro – Industry Level (Peer), includes Consumers, Suppliers, Customers, and Stake holders. This has considerable degree of influence on the Mktg Environment

Internal – Five Ms. Men, Money, Machinery, Material and Markets. Managing these factors is called Internal Marketing.

A mode of auditing or analysing the Mktg Environment is done via SWOT analysis. Other tools include PEST Analysis and Porter’s Five-Forces analysis.

S-Strength, W – Weakness, O – Opportunity, T-Threat

Any change in the Mktg environment will result in either an Opportunity/Threat in which the company is Strong/Weak.

Opportunity and Threat – External to the Organization. The organization does not have direct control over this.

Strength and Weakness – Internal to the Organization. The organization can either encash the opportunity using its strength or suppress the threat using its strength. The Strengths and Weaknesses are purely based on the capability of the company.

Based on the above four variables we can come up with the following matrix

T ‹—› S (Key focus area as it provides the value edge Advantage)

0 ‹—› S

T ‹—› W

0 ‹—› W

Listed in the order of priority.  0 ‹—› W is typically avoided from a Mktg Perspective as there is little control on the same.

In SWOT, strengths and weaknesses are internal factors. For example:A strength could be:

  • Your specialist marketing expertise.
  • A new, innovative product or service.
  • Location of your business.
  • Quality processes and procedures.
  • Any other aspect of your business that adds value to your product or service.

A weakness could be:

  • Lack of marketing expertise.
  • Undifferentiated products or services (i.e. in relation to your competitors).
  • Location of your business.
  • Poor quality goods or services.
  • Damaged reputation.

In SWOT, opportunities and threats are external factors. For example: An opportunity could be:

  • A developing market such as the Internet.
  • Mergers, joint ventures or strategic alliances.
  • Moving into new market segments that offer improved profits.
  • A new international market.
  • A market vacated by an ineffective competitor.

E.g Growing Economy is an Opportunity which could be leveraged provided the company can increase the capacity of Production

A threat could be:

  • A new competitor in your home market.
  • Price wars with competitors.
  • A competitor has a new, innovative product or service.
  • Competitors have superior access to channels of distribution.
  • Taxation is introduced on your product or service.

E.g. Inflation to Product Companies, Health Issues for COLA products

(Source :- http://www.marketingteacher.com/Lessons/lesson_swot.htm)

SWOT analysis are subjective and should be used as a guide only.

Key Factors impacting Environmental Analysis

→ Identify all factors possible

→ Prioritize the factors

→ Identify the factors as Opportunities/Threats and do a SWOT

Class Exercise on Identifying all the factors for Mobile Phones: – Technology, Bandwidth, Plans, Health, Literacy, Income etc

Posted in POM, SWOT | Tagged: , | Leave a Comment »

Updates from Rohit – Sessions Rescheduled and Exam Dates

Posted by shyamrajagopalan on June 12, 2008

Due to the technical failure last Sunday, an additional session has been scheduled on the 21st of June from 5:00 PM to 6:30 PM. Normal classes will continue post 6:30 PM.

Please find the dates and pattern of End term examination for the course of MANAC & Principles of Marketing.

Mode of examination – Hardcopy

Date 20-Jul-08, Sunday

Posted in Exam, Management Accounting, POM | Tagged: , | Leave a Comment »

Giving the Blog a Makeover….

Posted by shyamrajagopalan on June 11, 2008

Folks,

After seeing some good amount of participation, I have decided to give the blog a makeover to add a few more widgets and make this more user friendly. Hope you all like it. A few more things on the lines of sharing, colloborating and networking.

1. It would be great if some of the folks can co-author this blog. I am sure I will be bunking a few classes here and there and it would help if someone keeps the flow going, and hence the continuity of the blog will not be impacted. Also updates from TAs could be posted as soon as you know it. Volunteers… anyone?

2. Network.. Network.. Network… – KG’s Orkut site is a place where we could all network, share a bit more about ourselves and add value to this entire process. For all we may even get a pay hike by switching to better jobs! 🙂 (Srikanth, I hear you!) (I did flick the opening words from Nigam’s journal. Nigam, apologize for the Plagiarism) 🙂

3. Colloborate – I am sure we can lend a helping hand to fellow students by sharing… CA folks, Marketing folks can do a good summary piece on the subjects for Techies/other folks to catch up. I am sure there is going to be project work down the line in all the subjects. So let us be prepared…

Any other suggestions, please do keep me posted. I am very much reachable on this blog!

Posted in General | Tagged: , | Leave a Comment »